
🦾 Bitcoin shows resilience while market liquidity recovers
Bitcoin is currently trading within a stable but clearly defined market structure. After pulling back to around $69,500 last week, the price reclaimed the $70,000 level and remains within a range between its 2021 all-time high and the 2025 lows. What stands out is its relative strength compared to traditional assets. While gold fell significantly following the Fed's latest decision, Bitcoin remained comparatively stable within its range.
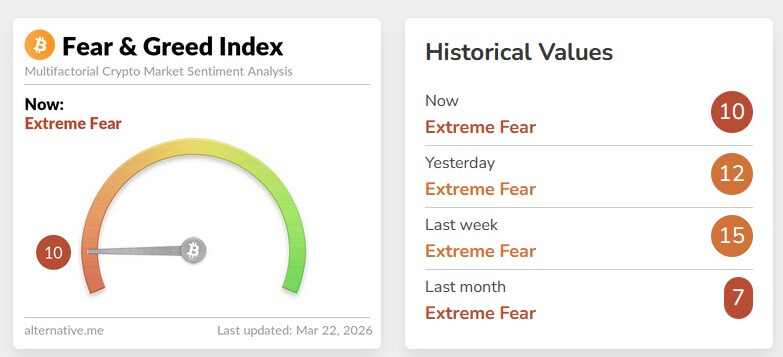
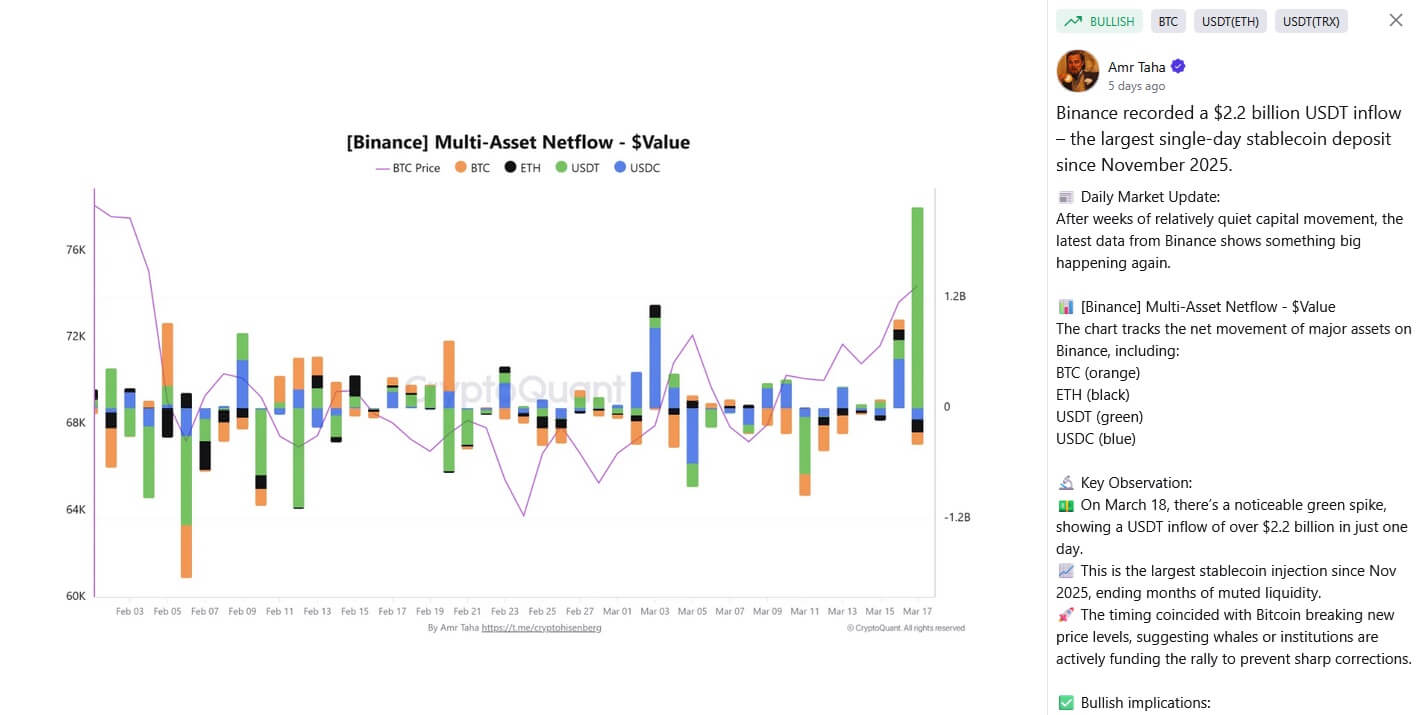
Despite persistent "Extreme Fear" sentiment in the Fear & Greed Index, the first signs of returning liquidity are emerging: Total market capitalization rose by approximately 7.65% in March, or $174 billion. Meanwhile, stablecoin reserves on exchanges rose significantly, partly due to a single deposit of 2.2 billion USDT. These funds represent short-term available capital that is increasingly flowing back into the market.
However, this is offset by a restrictive macroeconomic environment. The Federal Reserve is sticking to its interest rate policy and strictly linking any potential easing to progress on inflation, while the market is currently pricing in only one rate cut in 2026.
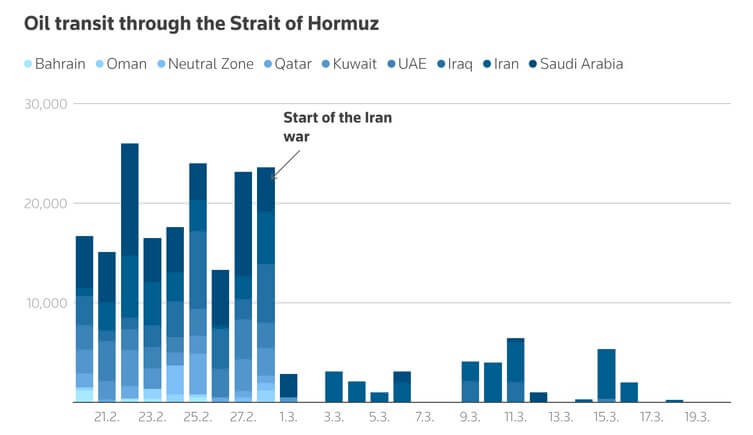
A potential rise in oil prices could add further pressure, pushing the American inflation toward 5% and further delaying interest rate cuts. In such a scenario, as we covered in our previous analysis of Bitcoin testing support levels, Bitcoin remains vulnerable to pullbacks toward $51,000.
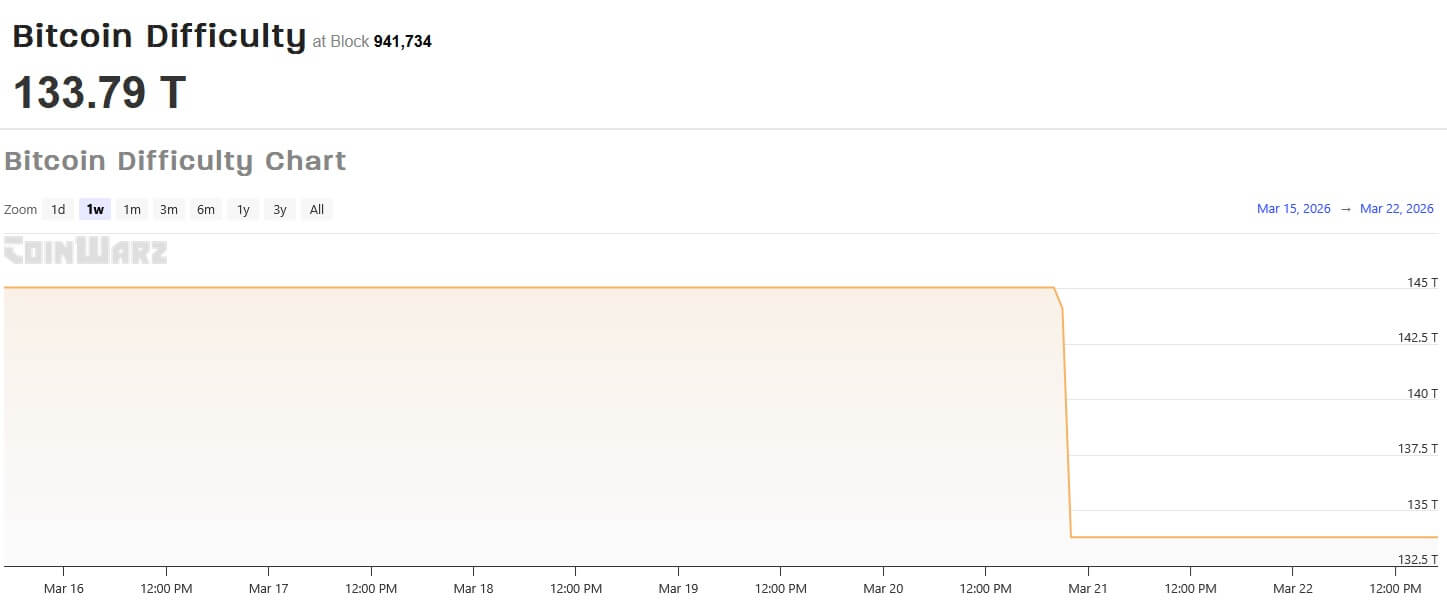
Structural indicators also paint a mixed picture. Mining difficulty has recently fallen by 7.7%, suggesting economic pressure in the sector, while increasing competition is emerging from AI infrastructure, which is vying for the same energy and computing resources.
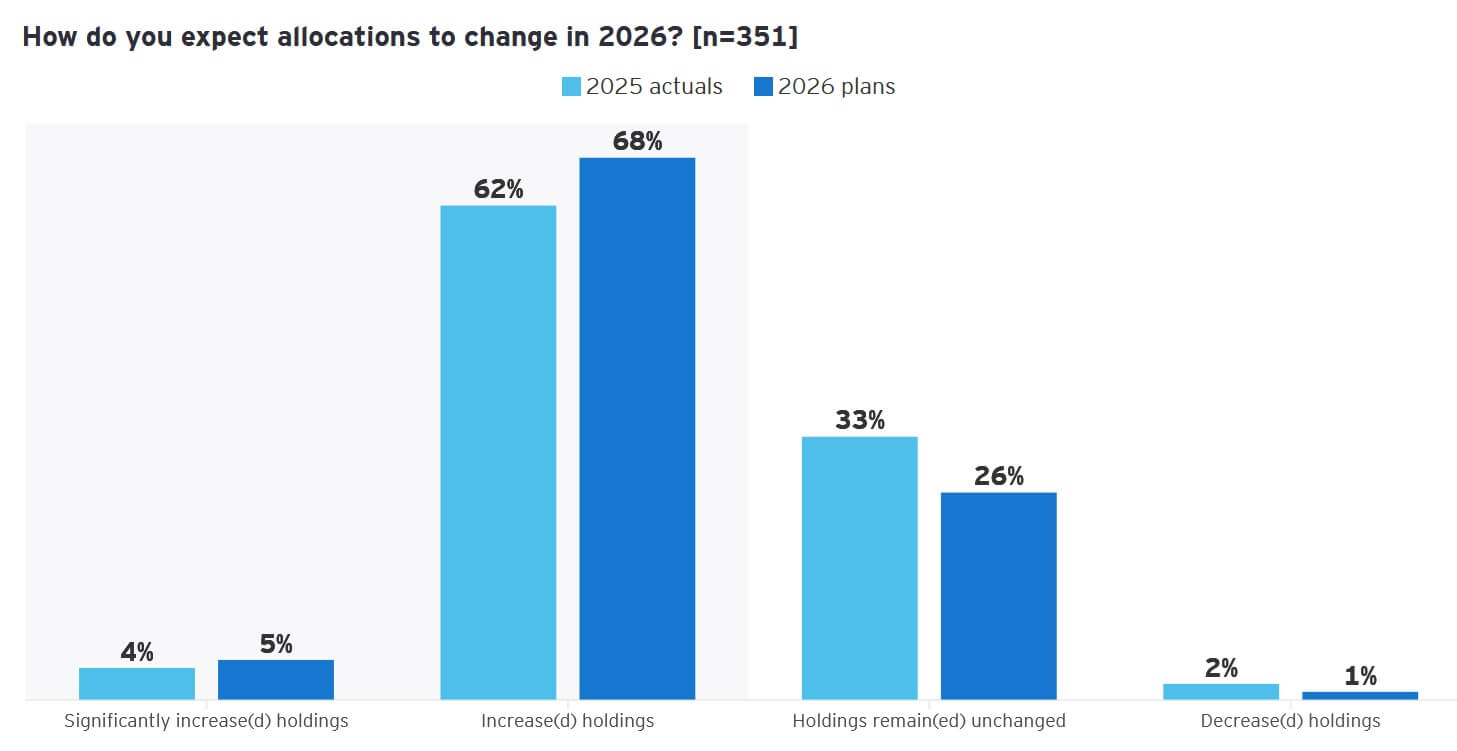
Meanwhile, the long-term outlook remains supported by institutional demand. 73% of investors plan to increase their allocations, with a growing focus on regulated products and active risk management.
Overall, there is tension between rising liquidity and macroeconomic constraints, which have so far prevented a clear trend from emerging.
💡 The current market phase is characterized less by a lack of demand than by limited momentum. Capital is returning, but it's encountering an environment that continues to dampen risk appetite. What matters isn't whether liquidity is available, but whether it can actually translate into sustained price movements under current macroeconomic conditions.
🖱️ Ethereum's one-click validator
Ethereum is currently evolving on multiple fronts simultaneously. While the technical infrastructure is being streamlined and accelerated, there are growing signs of increasing capital accumulation by major market players. Despite these advances, the Ether price remains well below previous highs and has only partially reflected these structural changes.
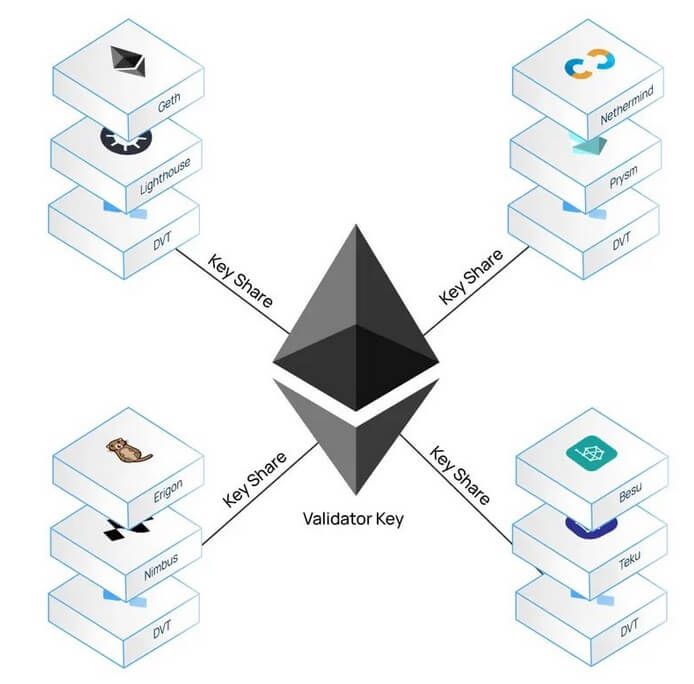
The current focus is on simplifying the staking process. Approximately 30% of the total ETH supply (around 37 to 38 million Ether) is now staked, distributed among nearly one million validators. However, many institutional players have not yet participated in this process directly, as operating their own validators remains technically complex and operationally demanding. Developers are therefore working on "one-click" solutions designed to enable the use of standardized, automated systems. Combined with simplified versions of Distributed Validator Technology (DVT), this could significantly simplify validator operations, reduce risks, and decrease reliance on third-party providers.
Simultaneously, Ethereum is working to improve its transaction infrastructure. The proposed "Fast Confirmation Rule" aims to reduce transfer times between Layer 1, Layer 2, and exchanges from the current average of over 13 minutes to around 13 seconds. The solution relies on evaluating validator signals rather than traditional block confirmations and could be implemented without a hard fork. However, doubts remain about whether the underlying assumptions (particularly regarding the decentralization of the staking share) will remain stable under stress conditions.
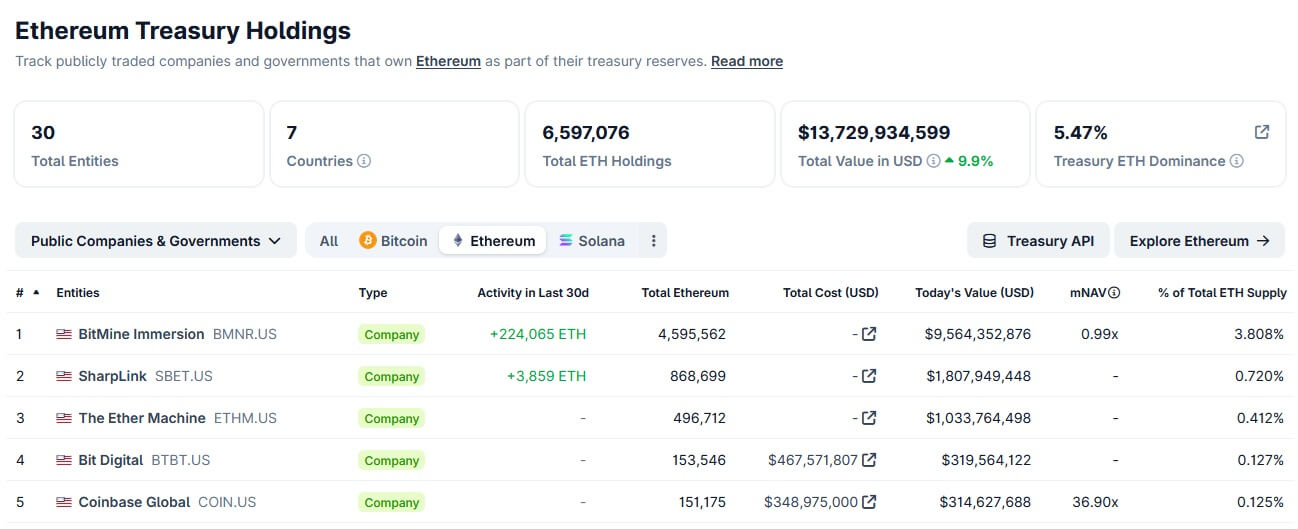
On the capital side, there are growing signs of accumulation. The publicly traded company Bitmine has expanded its holdings to approximately 4.6 million ETH, representing about 3.8% of the total supply. About two-thirds of these holdings are staked and are estimated to generate approximately $180 million in annual revenue. In total, public companies now hold about 5.47% of the Ether supply.
Meanwhile, large retail investors are also returning to the market. An early Ethereum whale recently built up a position worth around $19.5 million, while ETH continues to trade about 56% below its all-time high and institutional ETF inflows have recently been negative.
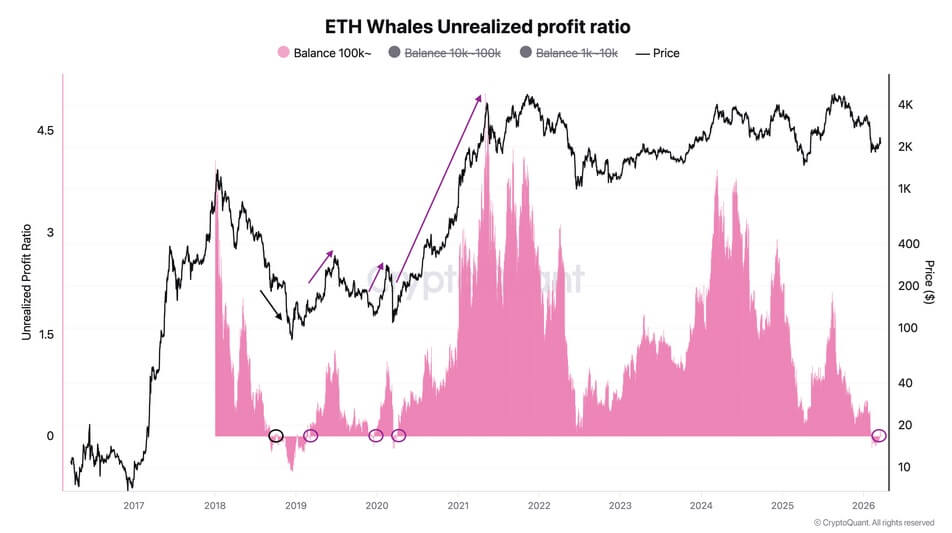
On-chain data provides further indications of a potential trend reversal. For the first time in weeks, the largest ETH wallets are back in aggregate profit territory, a signal that has often marked the start of upward trends in the past. Historically, similar patterns have been followed by average price increases of around 25% within three months and up to 50% over six months. However, this signal is not definitive. In certain market phases, further significant declines occurred despite comparable starting conditions.
Overall, Ethereum is currently in a state of transition. Technological simplification, infrastructure improvements, and increasing capital accumulation are occurring against the backdrop of a fragile market environment, building on the adoption paradox we covered in our previous issue.
💡 Current developments point less to an immediate market turnaround than to structural preparations for the next growth phase. What matters here is not just the return of capital, but whether Ethereum can actually translate institutional participation (facilitated by simplified infrastructure) into direct network activity. This is where the greatest potential lies, but also where centralization risks reside.
 Nasdaq approves tokenized stocks for mainstream trading
 Nasdaq approves tokenized stocks for mainstream trading
The tokenization of financial assets is increasingly becoming a central feature of traditional capital markets. The U.S. stock exchange Nasdaq has received last week the approval to trade tokenized stocks alongside traditional securities.
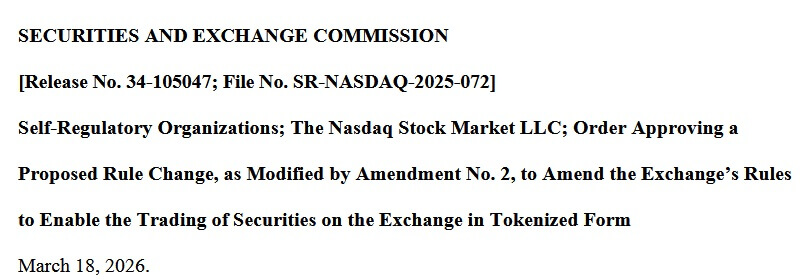
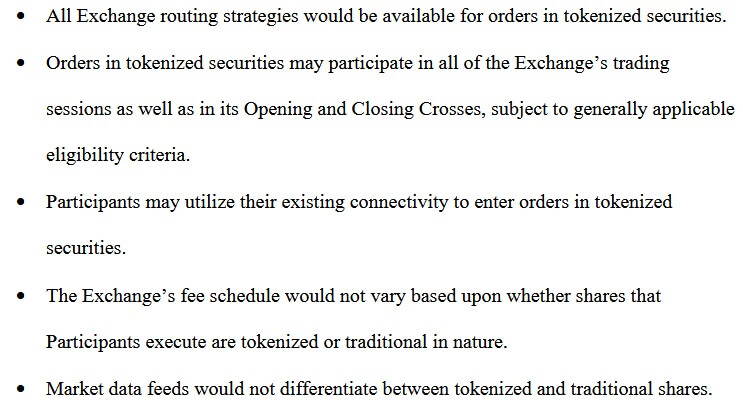
These will be listed on the same order book, at the same price, and with identical rights. Eligible participants include selected market participants as well as major U.S. equity and index ETFs. This move shows that tokenization is no longer viewed as an isolated experiment, but as an extension of existing market infrastructure.
Meanwhile, Moody's is transferring key elements of traditional financial markets to the blockchain. With the Token Integration Engine, the rating agency is bringing its credit analyses on-chain and integrating them into institutional workflows on the Canton Network.
This adds a crucial component to tokenization. Beyond representing assets, established risk assessments are now being integrated directly into digital market structures.
The market is also shifting on the yield side. EtherFi is investing $25 million in an RWA protocol and integrating tokenized yields directly into its platform.
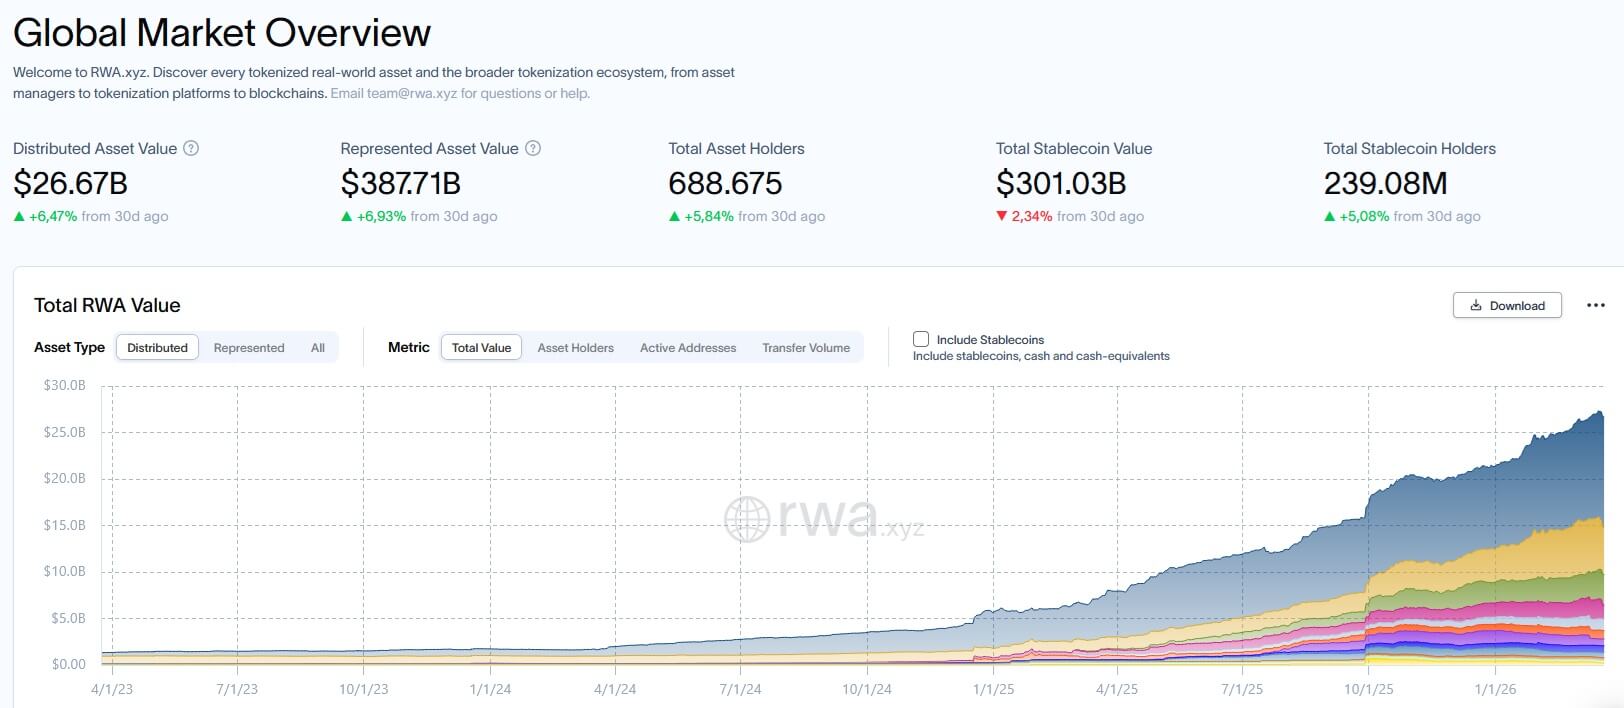
This gives users access to strategies that combine crypto returns, staking, and government bonds, which are options traditionally reserved for institutional investors. This development reflects strong market growth. The value of tokenized real-world assets has risen from approximately $5.7 billion to over $27 billion since the beginning of 2025, with tokenized U.S. government bonds accounting for the largest share, building on the remarkable growth we highlighted when tokenized stocks first crossed $1B.
A clear structural shift is emerging. Tokenization is evolving from a promise of efficiency into a central infrastructure for trading, valuation, and capital allocation.
💡 The key question is no longer whether tokenization works, but whether it will create stable market structures. Progress is clear in exchange integration, ratings, and yield products, but concentration among a few networks and players remains a structural risk.
🧠 Who will own the stablecoin disruption?
Stablecoins are increasingly emerging as an alternative to traditional payment and foreign exchange systems, with clear efficiency advantages particularly evident in emerging markets.
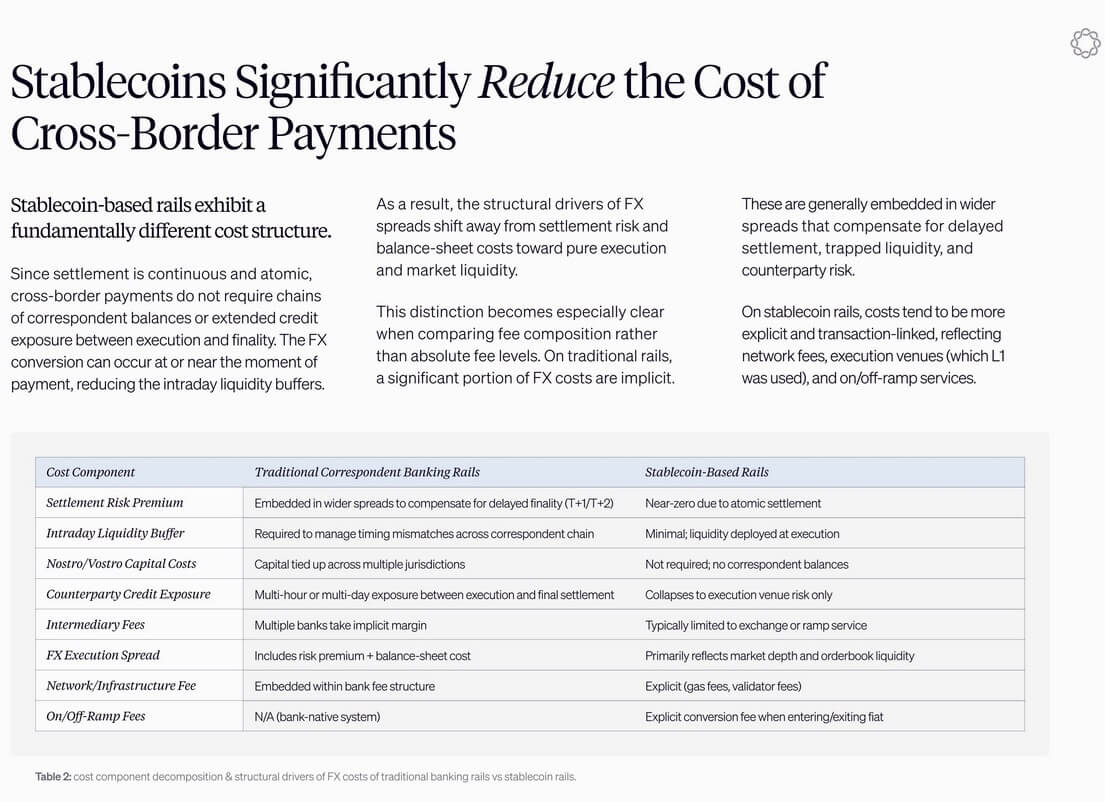
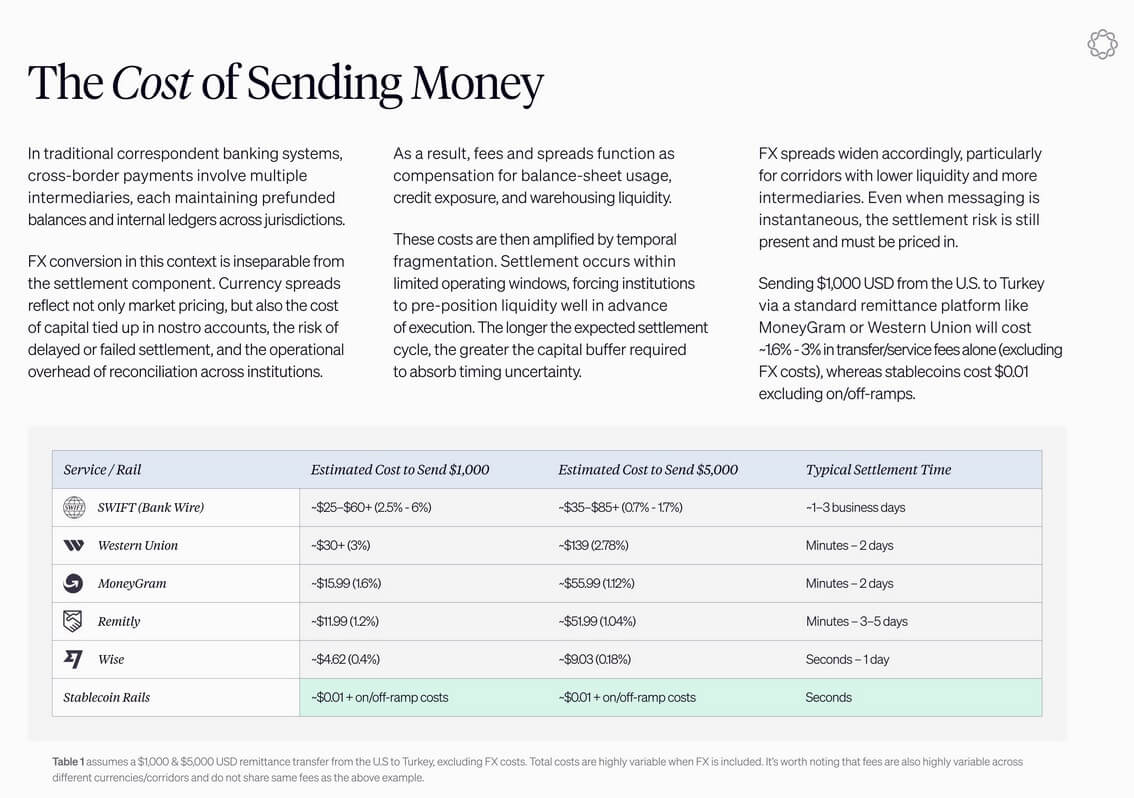
While traditional money transfers in markets like Argentina or Nigeria can incur fees of up to 8%, stablecoin transfers enable nearly instantaneous and significantly cheaper dollar transactions. A large portion of these costs stems from the underlying banking infrastructure, which is partially bypassed through direct on-chain settlement.
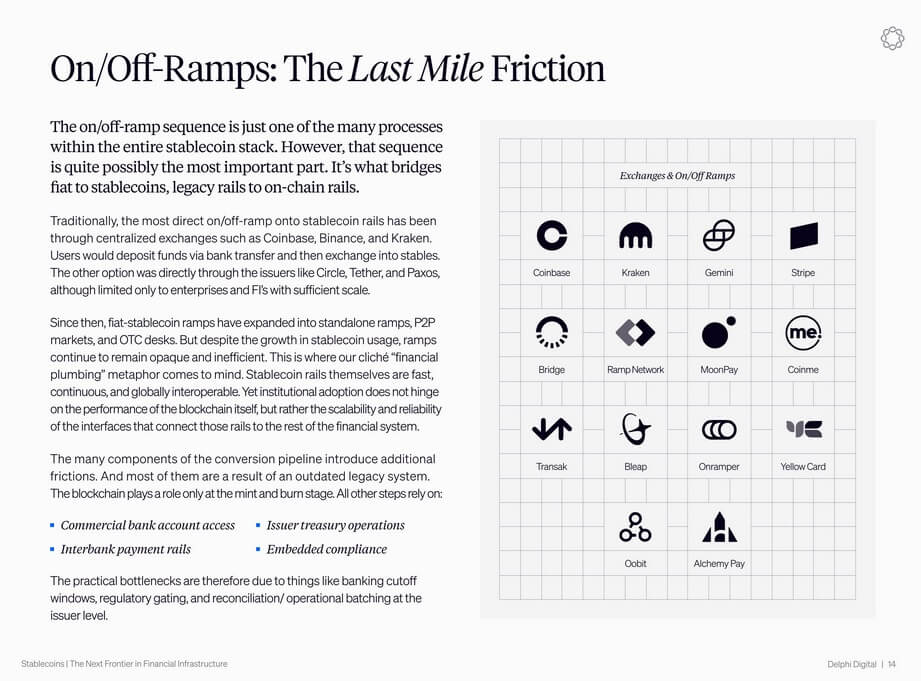
Despite these efficiency gains, a key bottleneck remains. The greatest friction doesn't arise on the blockchain itself, but at the interface between on-chain and off-chain systems. Bank transfers, regulatory requirements, and limited access to financial systems continue to hinder practical adoption.
While stablecoins can complement existing payment channels or replace them in certain markets, they still rely on integration into the traditional financial system.
Meanwhile, competition within the sector is shifting. Stablecoin issuers and fintech companies are increasingly building their own blockchain infrastructure to gain control over payment processing and fee flows.
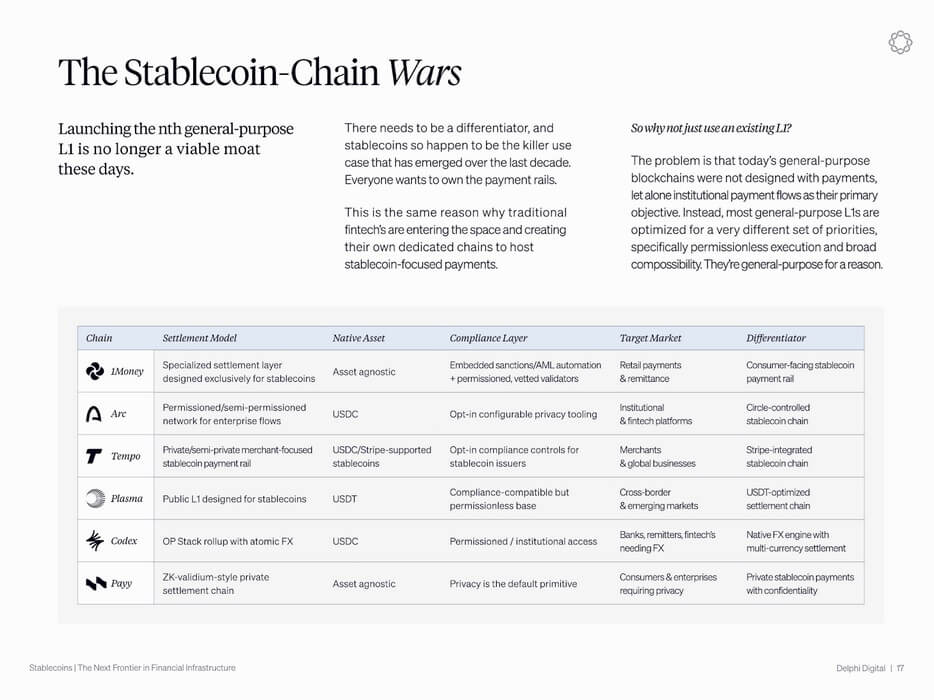
New networks are being developed specifically for stablecoin transfers, while companies strive to handle as many parts of the value chain as possible in-house, from wallets to settlement and clearing. Control over these payment rails is increasingly seen as a strategic advantage, as it determines the long-term distribution of revenue within the ecosystem.
The regulatory perspective is also coming into focus. In the U.S., there are signs of potential progress on the CLARITY Act, which addresses the regulatory treatment of yield-bearing stablecoin among other things. One proposal under discussion is a ban on returns for passively held stablecoins to limit outflows from the banking system. At the same time, proponents argue that clear regulation could facilitate additional capital inflows.
Overall, a structural shift is emerging. Stablecoins are evolving from a purely trading instrument into central infrastructure for global payment flows and digital dollar liquidity, building on the momentum we analyzed where USDC overtook Tether in monthly transfer volume.
💡 Stablecoins solve a real-world efficiency problem, but they also shift the balance of power within the financial system. While the technology partially replaces existing payment channels, dependence on banks and regulation persists. The key question isn't only how quickly stablecoins are growing, but who controls the interfaces through which value transfers into the traditional system.
🔎 Aave oracle glitch exposes DeFi risk management gaps
The Aave incident that we covered last week demonstrates how vulnerable automated DeFi systems can be, even when facing minimal events. A price deviation of just 2.85% in the wstETH token used as collateral triggered liquidations totaling approximately $27 million within a few hours. Crucially, the trigger wasn't a market movement, but a misconfiguration in the internal CAPO risk oracle.
The system temporarily valued wstETH at approximately 1.19 ETH instead of its actual market value of around 1.23 ETH. This discrepancy was enough to artificially push numerous positions below the required collateral thresholds.
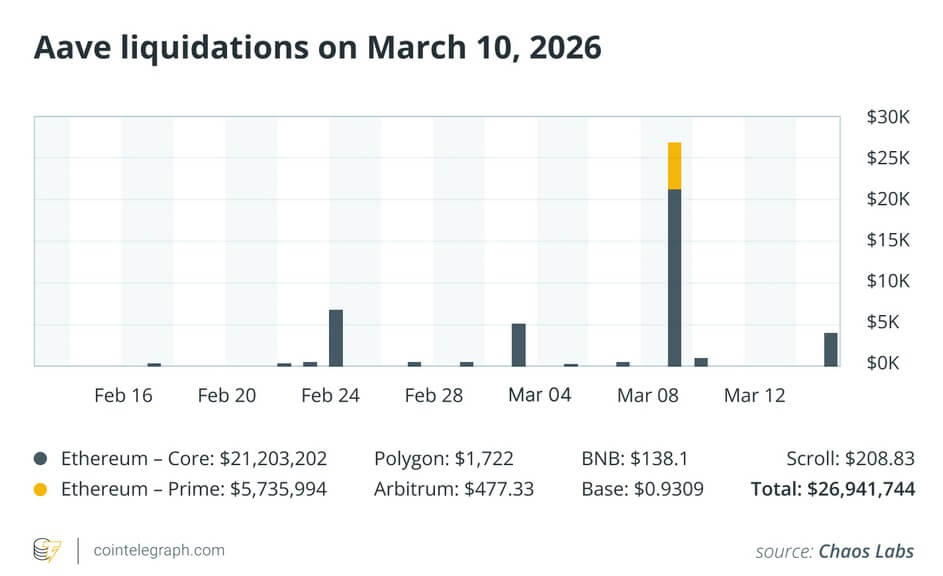
Since Aave operates fully automatically, affected positions were liquidated immediately. In total, approximately 10,938 wstETH were affected, while liquidators made about 499 ETH in profits. Although the protocol itself didn't incur any bad debt, the incident highlights how heavily DeFi relies on precise data processing.
The role of price oracles is particularly critical here. These provide external market data to smart contracts and directly determine collateral valuation, loan health, and liquidation timing. In this case, the error didn't lie in the price feed itself, but in additional risk logic: The CAPO system was intended to limit extreme price spikes, but it used outdated parameters, resulting in an artificial price cap below market value. This combination of a correct market price and flawed risk interpretation triggered the liquidation cascade.
The incident isn't isolated but part of a broader pattern. Shortly before, a user lost over $50 million in a token swap via the Aave interface. A combination of low liquidity, faulty routing infrastructure, and MEV activities resulted in the user receiving only about $36,500 worth of AAVE tokens while paying 50.4 million USDT.
Despite multiple warnings, the transaction was confirmed. Aave responded by introducing "Aave Shield," a protective feature designed to automatically block transactions with extreme price impact in the future.
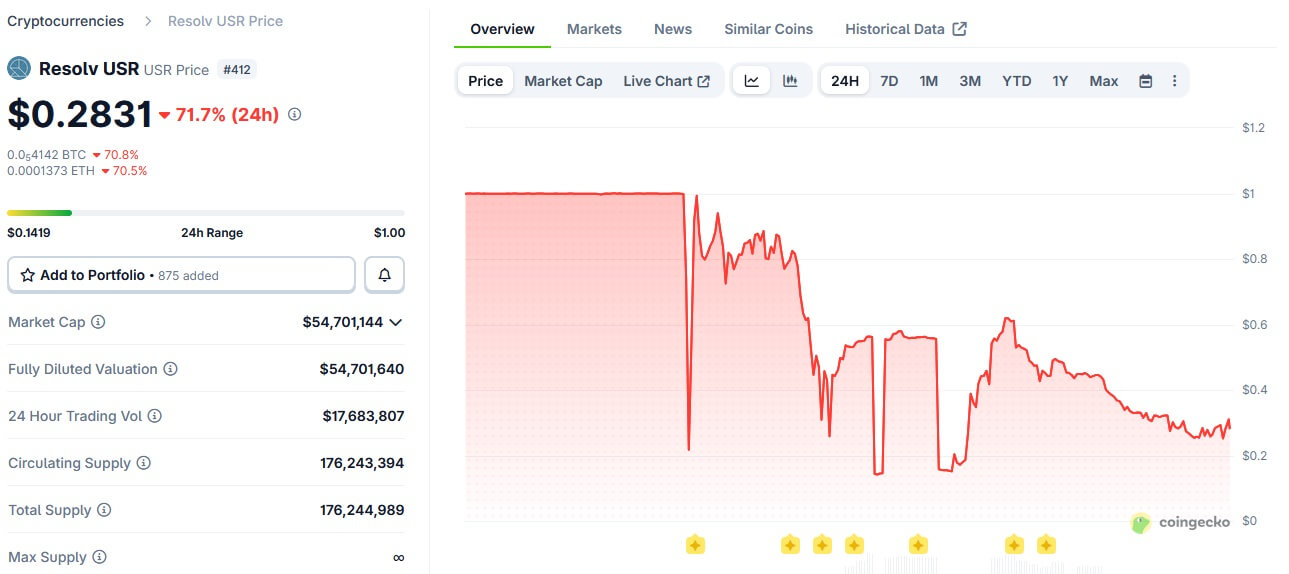
Other incidents highlight similar structural challenges. With the stablecoin USR, an exploit in the stablecoin's minting logic led to the creation of approximately 80 million unbacked tokens, causing the price to briefly drop to $0.14.
However, the impact remained largely localized, as affected protocols responded quickly and isolated the affected markets. Meanwhile, an attack on Bitrefill where a compromised employee device allowed access to hot wallets shows that operational security risks continue to play a central role.
Overall, a consistent picture emerges: DeFi is increasingly evolving into highly automated financial infrastructure, yet remains heavily dependent on the stability of technical systems, data sources, and operational processes.
💡 The Aave incident shows that the greatest risk in DeFi isn't volatility, but system logic. Minor technical deviations can lead directly to significant financial losses due to automation. Advances like "Aave Shield" address individual symptoms, but the central challenge remains: complex systems must be not only efficient, but above all, fault-tolerant.

